Sum it up!

Main page - general overview regarding functionalities & version history

Set up your Jira® to sum values from source to destination fields

Gadget which allows you to sum up data and display result in a table

Gadget which allows you to sum up data and data in a 2-d table

Plan workload of your team members using our planning gadget
Sum up data in a 2-d table gadget
Create 2-d tables containing data you need - you can select what data will be displayed in rows and columns. Helps you plan resources, combine statistics & much more!
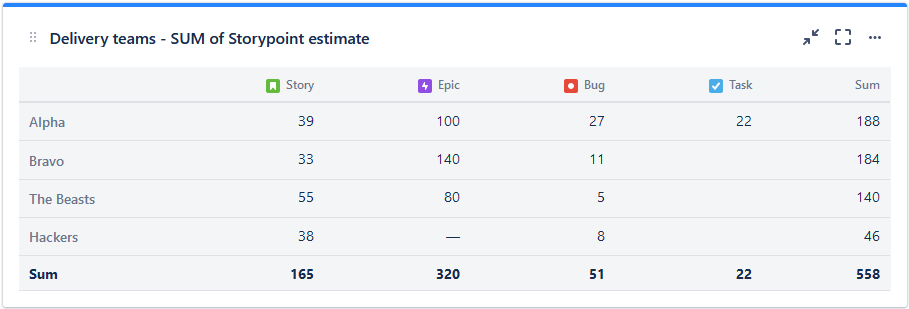
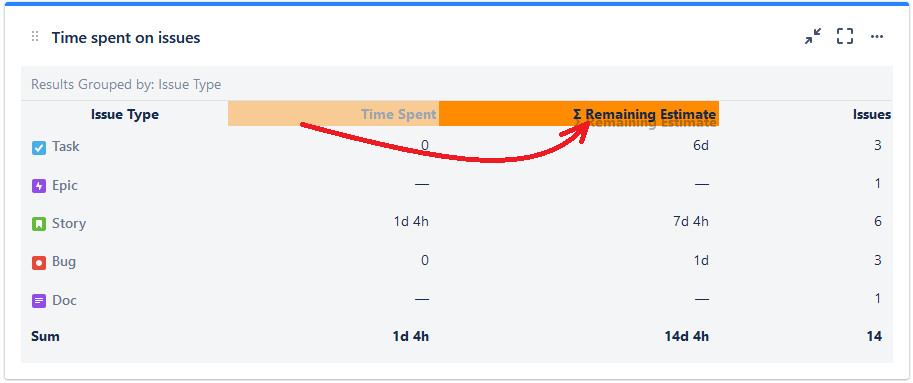
The 2-d table helps you to display a dependency between 2 values - such as count of types of issues in each of your projects, or sum of Story Points distributed within the release per issue type. It can also provide an overview of how your teams depend on components by summing number of work items per team & per component. If you need to look at specific numbers (not just the proportion), this table is a better option than using one of our charts.
Configuration
- Go to dashboard on which you're willing to place the Gadget
- Add Gadget called Planning report to the dashboard
- Fill in the details on the gadget configuration screen
- Saved filter (optional)
- JQL - select data you want to show in the table
- Fields to sum - select the fields you want to display in the table
- Rows values from - select parameter based on which you want to group your row data.
- Columns values from - select parameter based on which you want to group your column data.
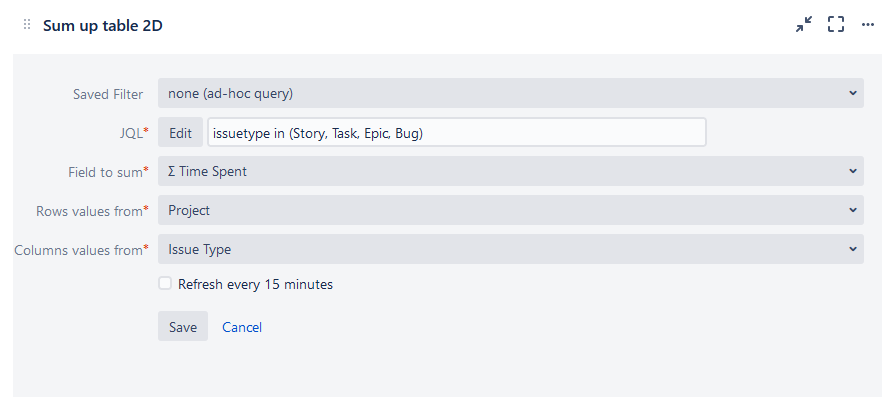
4. Click on button "Save" and now you see statistics you always wanted :)
Changing row/column order
If you want to change order of the rows or columns, you can use drag&drop functionality directly on the dashboard