Advanced analytics

Main page - general overview regarding functionalities

Gadget which allows you to view your data via Dependancy wheel

Gadget which allows you to view your data via Sankey diagram

Gadget which allows you to sum up data and display result in a bar chart

Gadget which allows you to sum up data and display result in a pie chart
Gadget which allows you to sum up data and data in a 2-d table
Sum up data in a 2-d table gadget
Create 2-d tables containing data you need - you can select what data will be displayed in rows and columns. Helps you plan resources, combine statistics & much more!
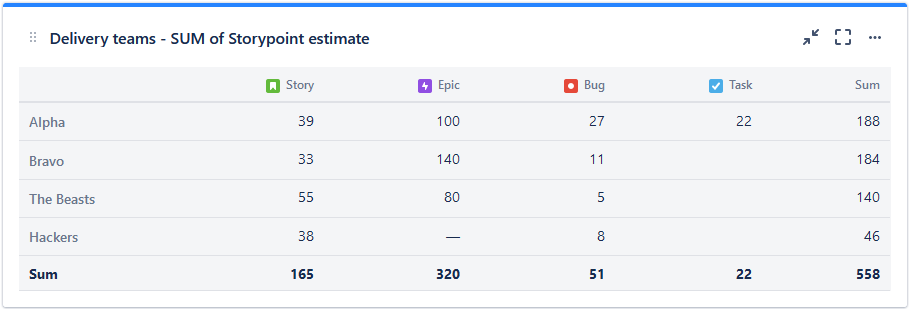
Typical usage of our 2-d table chart can be comparison of team statistics (such as number of issue types delivered within Sprint per team, or per team member. Based on this table you know which team focuses more on development of new features and which one focuses on production issues. It can also help you build t-shape within your team based on identification of typical work items for each team member.
Configuration
- Go to dashboard on which you're willing to place the Gadget
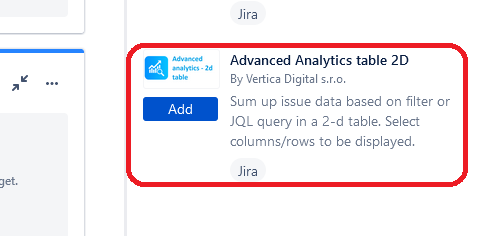
- Add Gadget called "Advanced Analytics table 2D" to the dashboard
- Fill in the details on the gadget configuration screen
- Saved filter (optional)
- JQL - select data you want to show in the table
- Fields to sum - select the fields you want to display in the table
- Rows values from - select parameter based on which you want to group your row data.
- Columns values from - select parameter based on which you want to group your column data.
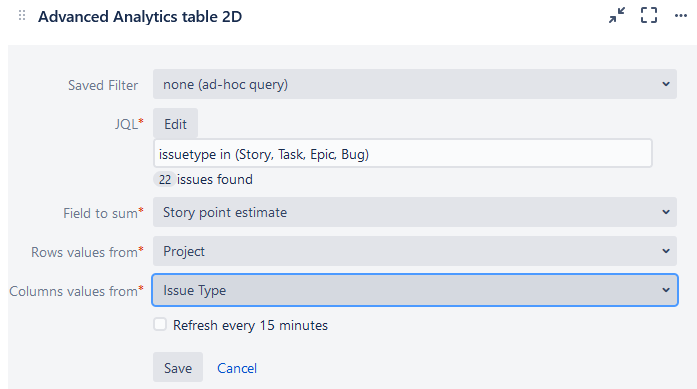
4. Click on button "Save" and now you see statistics you always wanted :)