Advanced analytics

Main page - general overview regarding functionalities

Gadget which allows you to view your data via Dependancy wheel

Gadget which allows you to view your data via Sankey diagram

Gadget which allows you to sum up data and display result in a bar chart

Gadget which allows you to sum up data and display result in a pie chart

Gadget which allows you to sum up data and data in a 2-d table
Sum up data using Dependency wheel chart gadget
Create a dependency wheel in order to understand different statistics, such as number of bugs in a Release per team, unfinished type of issues and much more!
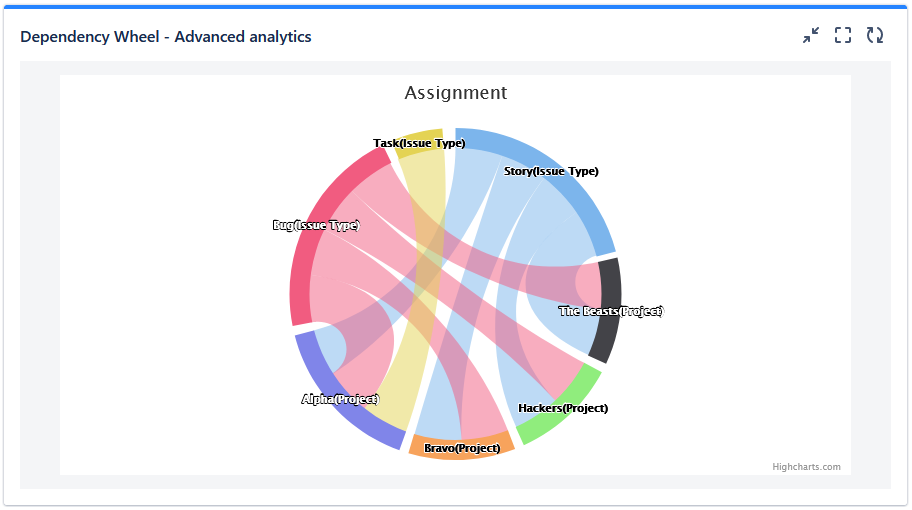
Dependency wheel helps you understand which teams represent an effective bottleneck (most of the teams are dependent on them) within your system of delivery. Based on these statistic you might want to re-shuffle your teams composition or improve certain skillset. It also visualizes how strong the dependency is (which is represented by size of the connector). Using this chart provides you the overall picture of all dependencies between all entities (which is there by default), but also enables you to focus just on a specific part of the chart.
Configuration
- Go to dashboard on which you're willing to place the Gadget
- Add Gadget called "Dependency Wheel - Advanced Analytics" to the dashboard
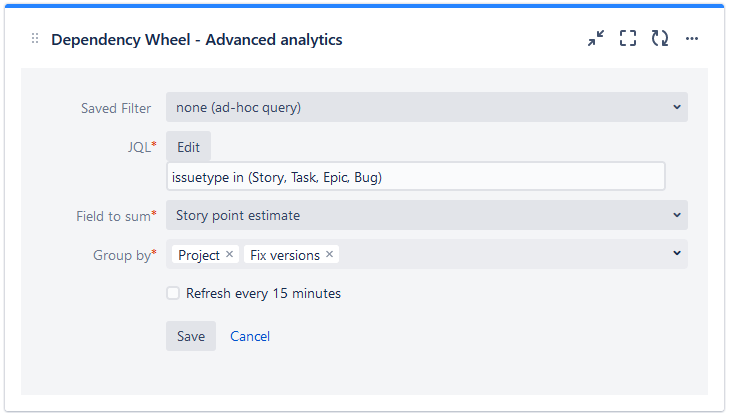
- Fill in the details on the gadget configuration screen
- Saved filter (optional)
- JQL - select data you want to show in the table
- Fields to sum - select the fields you want to display in the table
- Group by - select parameter based on which you want to group your data.
4. Click on button "Save" and now you see statistics you wanted :)